
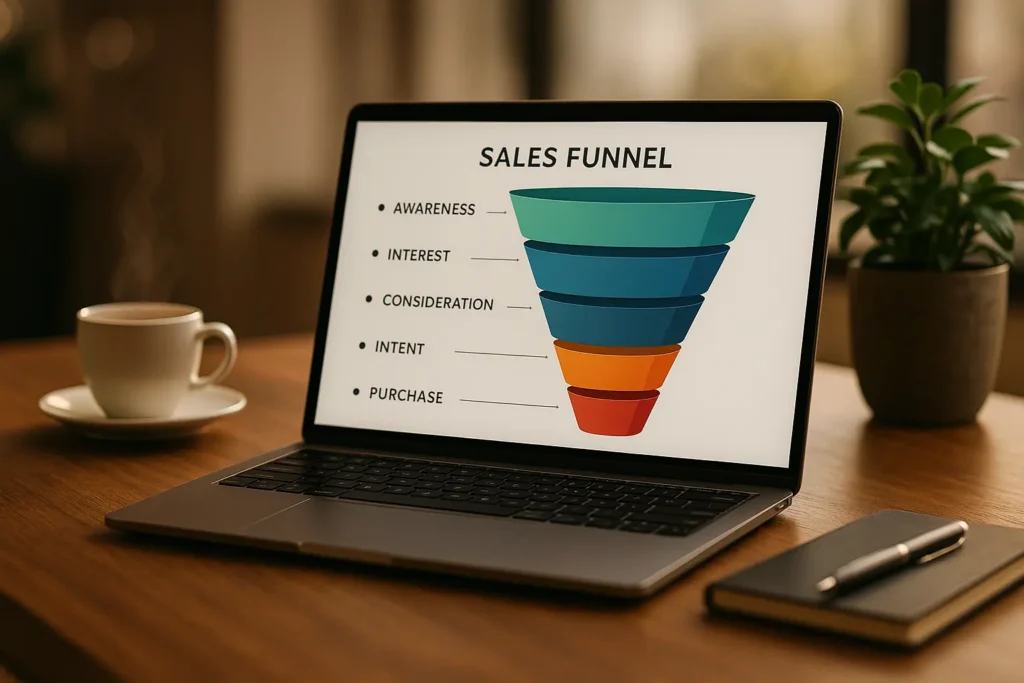
The funnel everyone builds from scratch is a hundred and two years old. William Townsend drew it in a 1924 sales manual called Bond Salesmanship, laying a funnel shape over a stage model that had been circulating since 1898. Nothing about the drawing has aged badly. What has aged badly is the assumption that filling the top wide enough eventually fixes the bottom.
Key takeaways
- Baymard puts average cart abandonment at 70.22 percent across 50 compiled studies.
- 40 percent of abandoners with a stated reason cite extra costs at checkout.
- Roughly one experiment in three improves the metric it targeted, on Microsoft data.
- Consent and opt-out rules apply to the capture step from day one, not after launch.
Where the shape came from, and what it hides
The stage model underneath the funnel is usually credited to E. St. Elmo Lewis, who in 1898 described advertising as needing to attract attention, hold interest and create desire, with action added later. The acronym AIDA arrived considerably afterwards, coined by C. P. Russell in 1921. Historians of advertising have since challenged how cleanly the model can be attributed to Lewis at all, which is worth knowing before anyone presents the funnel as settled science.
The shape carries one assumption that deserves examination. A funnel narrows continuously, which implies people only ever exit. Real buyers leave, return weeks later, compare, ask a colleague, and re-enter somewhere in the middle. Treating the diagram as a model of behaviour produces bad decisions. Treating it as a bookkeeping device, a way of counting how many people are at each stage right now, produces useful ones.
Build backwards from the only honest number you have
The checkout is where a funnel stops being a theory. The Baymard Institute, in a meta-analysis of 50 published studies last updated on 22 September 2025, puts the average documented cart abandonment rate at 70.22 percent. That average has held in the high sixties to low seventies for more than a decade, which is itself the interesting part: a decade of funnel optimisation has not moved it.
The reasons matter more than the headline. Around 42 percent of US shoppers who abandoned were browsing and never intended to buy, which no design change will recover. Among those who abandoned for an actual reason, the distribution is unusually actionable.
| Stated reason for abandoning | Share of abandoners | Where it belongs in the build |
|---|---|---|
| Extra costs too high (shipping, tax, fees) | 40% | Pricing and display, before any campaign |
| Delivery too slow | 20% | Operations, not marketing |
| Did not trust the site with card details | 19% | Proof and payment options at the decision stage |
| Account creation required | 18% | Checkout design |
| Checkout too long or complicated | 17% | Checkout design |
| Site errors or crashes | 17% | Engineering, before anything else |
Read that column on the right and the build order writes itself. Two of the six leading reasons are engineering and logistics problems that no funnel copy will solve, and the largest single one is a decision about when you disclose a price.
The order we would build it in
- Fix the checkout first. Guest checkout, total cost visible before the final step, and a payment method your audience already uses. This is the cheapest conversion work available and it is almost always undone.
- Define one qualifying action. Not a lead, an action: a demo booked, a cart created, a trial started. Something a person did, not something a form recorded.
- Instrument the stages before writing content for them. If you cannot count how many people are sitting at a stage today, you cannot tell whether anything you do next worked.
- Build the decision stage. Comparison information, objections answered in plain language, and evidence a sceptical buyer would accept. This is where the 19 percent trust problem gets solved.
- Build the capture step, with its consent handling designed in. Not bolted on afterwards. See the legal section below.
- Only then add traffic. Paid acquisition into an untested funnel buys you a faster measurement of the same leak.
- Set a review cadence. Monthly is usually enough; the numbers move slowly and reacting to noise is the most common self-inflicted wound.
Step five deserves emphasis because email is where the funnel makes most of its money after the first visit, and it is systematically under-resourced. We made that argument at length in our piece on why email is still an underrated conversion channel.
Why most funnel optimisation changes nothing
Because most ideas do not work, and that is not a criticism of anyone. Ron Kohavi, who ran experimentation at Microsoft, reported a distribution that has been reproduced across several large organisations: of carefully designed experiments intended to improve a key metric, roughly one third succeeded, one third produced no statistically significant difference, and one third made the metric worse.
Two consequences follow for a small funnel. The first is that testing is worth doing mainly where traffic is high enough to detect a real effect, which for most sites means the checkout and nothing else. The second is that below that threshold, the honest move is to copy well established patterns rather than to run underpowered tests and read the noise as evidence. A guest checkout option does not need validating locally. It has been validated everywhere.
The step people bolt on last, and should not
Every funnel captures data at the point it captures a lead, and the rules attach at that moment rather than at first send. In the European Union, the GDPR requires a lawful basis and a freely given, informed consent for marketing email in most consumer cases, with pre-ticked boxes explicitly ruled out. In the United States, the CAN-SPAM Act is an opt-out regime with hard mechanics: an unsubscribe request must be honoured within 10 business days, and the opt-out mechanism must keep working for at least 30 days after the message was sent.
Designing this in costs an afternoon. Retrofitting it costs a list. If your funnel serves both markets, build to the stricter of the two and keep the consent record with the contact, because the burden of proving consent sits with you rather than with the subscriber.
None of this makes a funnel a machine that turns spend into customers at a fixed rate, and any model that claims a predictable rate is describing a past average rather than a forecast. What a well built funnel gives you is narrower: a set of stages you can count, one number per stage, and a defensible answer to the question of where the next hour of work should go.
Built one already and it stalled?
The failure modes of an existing funnel are different from the ones you meet building a new one.
Sources: Baymard Institute, compiled cart abandonment statistics, average of 70.22 percent across 50 published studies, page last updated 22 September 2025, with stated abandonment reasons of 40 percent extra costs, 20 percent slow delivery, 19 percent card details distrust, 18 percent forced account creation, 17 percent long checkout and 17 percent site errors, and 42 percent of US shoppers abandoning while only browsing; E. St. Elmo Lewis, 1898, for the attention, interest and desire sequence, the acronym AIDA attributed to C. P. Russell in 1921 and the funnel diagram to William W. Townsend, Bond Salesmanship, 1924, with the note that the attribution to Lewis has been questioned in later advertising history scholarship; Ron Kohavi and colleagues on online controlled experiments at Microsoft, reporting that roughly one third of designed experiments improved the target metric; Regulation (EU) 2016/679 (GDPR) on consent for direct marketing; CAN-SPAM Act and Federal Trade Commission compliance guidance on the 10 business day opt-out and the 30 day validity of the opt-out mechanism. Abandonment figures are compiled averages across studies and vary widely by sector and device. This article is general information and not legal advice on your own consent obligations. Updated August 2026.