
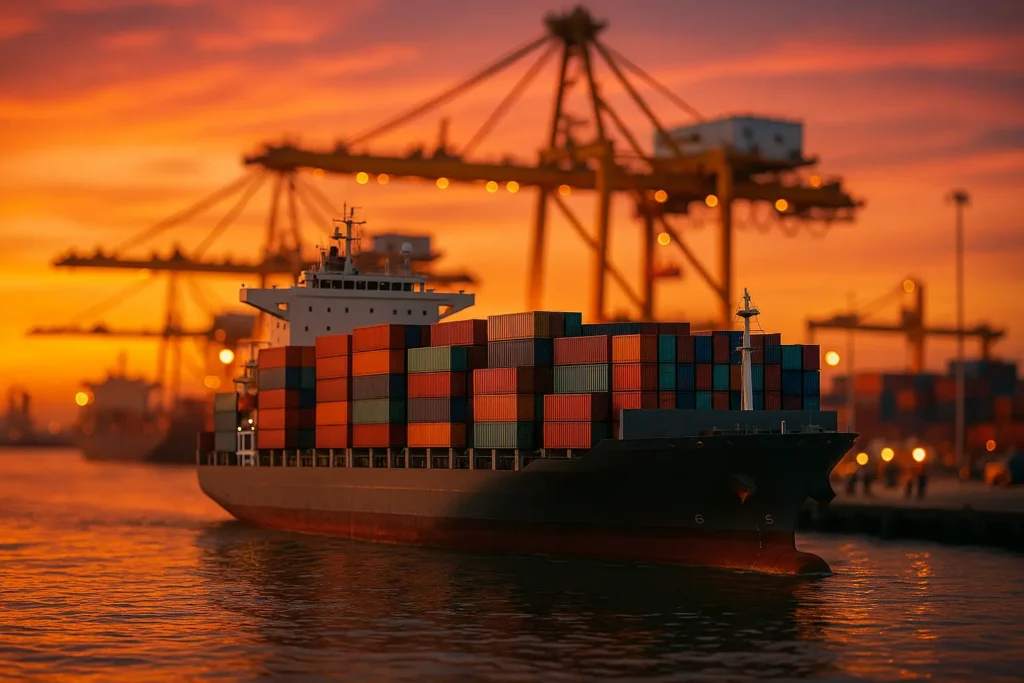
On 6 August 2026, Drewry assessed the cost of moving a forty-foot container on its composite World Container Index at 4,297 dollars. The pandemic peak was 10,377 dollars in September 2021. The 2019 average, before any of this started, was 1,420 dollars. Five years on, the price of shipping a box is back down from the panic and has settled at roughly three times what the industry once called normal. That gap is the lesson.
Key takeaways
- Container rates sit near three times the 2019 average without any acute crisis running.
- Rerouting away from Suez adds one to two weeks per voyage and absorbs fleet capacity.
- Suez Canal revenue rose 18.5% year on year in the first half of FY2025/2026, from a low base.
- Carriers introduced Emergency Fuel Surcharges from August 2026 after renewed Gulf tension.
Three different crises wearing one label
Talking about “the shipping crisis” as a single event is the first mistake, because the three phases had different causes and rewarded different responses. The 2020 to 2021 phase was a demand and capacity story: consumer spending shifted from services to goods while ports and inland networks lost throughput to health measures. Rates went to 10,377 dollars because there was too much cargo for the system, not because a route had closed.
The 2023 to 2025 phase was a routing story. Vessels avoiding the Red Sea went around the Cape of Good Hope, which by carriers’ own accounts adds one to two weeks per voyage compared with the Suez transit. Nothing was destroyed. The same ships simply spent longer at sea, and effective capacity fell as a result. The current phase, in 2026, is a geopolitical risk story: renewed hostilities involving Iran and the United States in late July 2026 raised uncertainty over the Strait of Hormuz, and several carriers introduced Emergency Fuel Surcharges from August.
| Reference point | Composite rate, 40ft container | What was driving it |
|---|---|---|
| 2019 average | 1,420 dollars | Structural overcapacity, thin carrier margins |
| September 2021 peak | 10,377 dollars | Goods demand surge meeting congested ports |
| 6 August 2026 | 4,297 dollars, up 1% on the week | Transpacific strength, unresolved routing risk |
Read that middle column as a range rather than a trend line. The index moves weekly, and the same assessment that recorded the rise on 6 August followed three consecutive weeks of decline, with Shanghai to New York up 4% and Shanghai to Los Angeles up 3% on the week.
What the canal numbers show about how slowly normal returns
They show that traffic comes back years after the headlines stop. Figures given by the Suez Canal Authority and reported in February 2026 put revenue at 449 million dollars from 1,315 vessels carrying 56 million tons in early 2026. Transits were up 5.8%, net tonnage up 16% and revenue up 18.5% against the same period of the previous fiscal year, with the authority dating the start of the recovery to the final quarter of 2025 and linking it to improved security conditions in the region.
Those are healthy percentages against a badly depressed base, which is the point. Rebuilding a routing is not a switch. Carriers restore services network by network, insurers reprice, and shippers wait to see whether the first sailings run clean before they move their own volumes back.
Just-in-case is a cost you chose, not a strategy
The most repeated conclusion from 2021, that industry should move from just-in-time to just-in-case, was half right and got expensive. Holding more inventory does buy time, but it converts a service risk into a working capital cost, and it does nothing at all if the buffered item and its substitute both travel through the same chokepoint.
What we saw work better was cheaper and duller: knowing your exposure. That means mapping which inputs cross which canal, which supplier sits behind your supplier, and which of your product lines actually stops if a particular lane goes to fourteen extra days. Firms that had that map made small early moves. Firms that did not bought a lot of inventory of the wrong things. The same reasoning applies to material dependencies as much as to freight lanes, which is why the conversation about concentration in rare earth supply is a freight conversation as much as a mining one.
The lesson that did not make the headlines
It is that resilience showed up as an information problem rather than a physical one. Ports were rarely the binding constraint for long. What repeatedly failed was the ability to answer a simple question quickly: where is our cargo, what is it sitting behind, and what does the delay cost us this week rather than this quarter.
That is also why the digital investment made during this period has held up better than the inventory strategy. Real-time visibility and route-level scenario planning survive a return to calm because they are useful in calm. A warehouse full of precautionary stock does not, and its cost is visible on every balance sheet review until somebody writes it down.
Questions this raises
Are freight rates going to return to 2019 levels?
There is no basis to promise that. The 2019 average reflected a period of structural overcapacity that carriers have since managed away through consolidation and capacity discipline. Rates could fall a long way from where they are and still sit above 1,420 dollars.
Does nearshoring solve the exposure?
It shortens some lanes and moves others. A plant relocated closer to its market often still imports components through the same chokepoints, so the honest test is whether nearshoring changes the route of the input that would actually stop your line, not the route of the finished good.
How much notice do shippers realistically get?
Less than the planning cycle assumes. Surcharges and routing changes have been announced weeks ahead in this period, while contracted rates and production plans run in quarters. Closing that gap is a scheduling problem more than a forecasting one.
Is any single index enough to track this?
No. A composite rate blends very different trades, and the Transpacific and Asia to Europe legs have moved independently more than once since 2024. If a specific lane matters to your business, watch that lane.
Wondering what visibility actually looks like in practice?
One sector has gone further than most in tracing every unit along the chain, with mixed results.
See what traceability delivered in pharmaceutical supply chains
Sources: Drewry World Container Index, assessment of 6 August 2026, for the composite rate of 4,297 dollars per 40ft container, the weekly movement, Transpacific lane changes and the commentary on renewed Iran and United States hostilities in late July 2026 and Emergency Fuel Surcharges from August; Drewry’s published reference points of 10,377 dollars in September 2021 and a 2019 average of 1,420 dollars; Suez Canal Authority figures attributed to chairman Osama Rabie and reported in February 2026 for 449 million dollars of revenue, 1,315 vessels, 56 million tons, transits up 5.8%, net tonnage up 16% and revenue up 18.5% year on year. Container indices move weekly and the figures above are point-in-time assessments, not forecasts. Updated August 2026.